State of GEO: August 2026
AI Search Readiness Across 282 Domains
The third edition of the State of GEO benchmark covers 282 unique domains audited in August 2026, scored on the same open-source 100-point, eight-category v1 rubric. The average score rose 2.3 points to 56.4 — the biggest month-over-month gain since the series began — even as the cohort shrank 22% from July. Nearly every signal we track improved: llms.txt adoption rebounded to 62.8%, Organization schema jumped almost 10 points, and the share of sites reaching "Good" or better climbed to 29.1%. One category refused to move: AI Discovery is still stuck at 10% efficiency, three months running.
Executive summary — August 2026
n = 282 · 1–31 Aug 202656.4
avg GEO score / 100 (+2.3 vs July)
282
unique domains (−78 vs July)
62.8%
have llms.txt (+8.6pp vs July)
29.1%
Good or better (+4.4pp vs July)
- The average jumped 2.3 points to 56.4 while the cohort shrank from 360 to 282 domains. July's sample was inflated by a traffic spike; August's smaller cohort scored meaningfully higher.
- llms.txt adoption rebounded hard: 54.2% → 62.8% (+8.6pp), fully reversing July's dip. Full structured files rose to 30.1%.
- Organization schema was the single biggest mover: 52.2% → 62.1% (+9.9pp). FAQ schema rose to 22.3% despite Google retiring FAQ rich results in May 2026.
- AI Discovery is frozen at 10.0% efficiency for the third month. And crawler blocking ticked up for the first time: 14.2% of sites now block at least one AI bot.
source: benchmark_audit_events · GET /api/public/benchmark
Score distribution: the floor keeps rising
The average GEO score across 282 unique domains is 56.4 out of 100 — up 2.3 points from July's 54.1 and 2.8 points from June's 53.6. The median is 59, with the bottom quarter of sites scoring at or below 44 and the top quarter at or above 69. The highest score is 100; the lowest is 7. This is the largest single-month improvement in the benchmark's short history, and it happened while the cohort shrank — a point worth unpacking, which the month-over-month section does below.
The band breakdown shows the improvement is broad, not top-heavy:
| Band | Score range | Domains | Share | July 2026 | What it means |
|---|---|---|---|---|---|
| Excellent | 86–100 | 7 | 2.5% | 1.9% (7) | All categories well covered. Citable by AI with confidence. |
| Good | 68–85 | 75 | 26.6% | 22.8% (82) | Strong fundamentals. Minor gaps in entity signals or AI discovery. |
| Foundation | 36–67 | 162 | 57.4% | 61.1% (220) | Reachable by AI but thin on structure, entity, and discovery signals. |
| Critical | 0–35 | 38 | 13.5% | 14.2% (51) | Significant barriers — blocked crawlers, missing schema, no AI signals. |
The practical reading is unchanged in shape but better in degree: roughly seven in ten audited sites still cannot be described, cited, or recommended by an AI engine with confidence. But the Good band grew from 22.8% to 26.6%, Critical shrank from 14.2% to 13.5%, and the Foundation middle thinned from 61.1% to 57.4% — sites are climbing out of the middle tier, not just arriving into it. Three months in, the trend line on "below Good" is 79.2% → 75.3% → 70.9%. Consistent, if slow.
Category breakdown: llms.txt is the biggest gainer
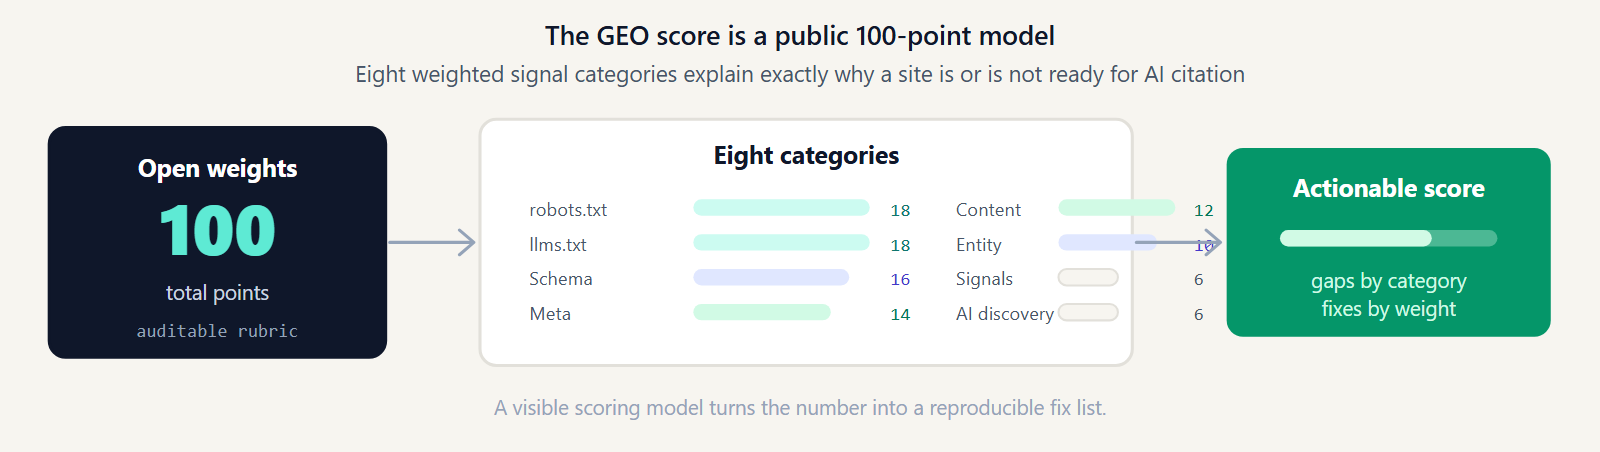
The v1 GEO rubric used for this edition scores eight categories (the current default, v2, has nine since engine 4.19.0), each with a different maximum. The table below shows the August 2026 average for each, the maximum, and the efficiency percentage — how much of the available points the average site captures — alongside the June and July efficiencies for context.
| Category | Avg | Max | Aug eff. | Jul | Jun | |
|---|---|---|---|---|---|---|
| Meta tags | 12.6 | 14 | 90% | 88.6% | 88.6% | |
| Content quality | 9.4 | 12 | 78.3% | 80% | 80% | |
| Robots & crawler access | 14 | 18 | 77.8% | 76.1% | 75.6% | |
| Technical signals | 3.7 | 6 | 61.7% | 61.7% | 61.7% | |
| Schema markup | 7.2 | 16 | 45% | 42.5% | 38.1% | |
| LLMs.txt | 7.8 | 18 | 43.3% | 36.1% | 38.9% | |
| Brand & entity | 4.1 | 10 | 41% | 38% | 38% | |
| AI discovery | 0.6 | 6 | 10% | 10% | 8.3% |
The top of the table is stable. Meta tags lead at 90.0% efficiency, Content quality holds at 78.3%, and Robots and crawler access improved to 77.8% — the average site now explicitly allows 23.8 AI bots. These three categories are hygiene: broadly understood, broadly implemented, and not where the score is won or lost.
The movement is in the middle. LLMs.txt efficiency rose from 36.1% to 43.3% — a 7.2 percentage-point gain, the largest of any category, and a full reversal of July's 2.8-point decline. Schema markup continued its climb from 42.5% to 45.0%, and Brand & entity broke its two-month flatline, rising from 38.0% to 41.0% on the back of the Organization schema surge. Every mid-tier category is now trending up together.
The exception, again, is AI Discovery at 10.0% — an average of 0.6 points out of 6, identical to July and barely above June's 8.3%. It is the only category in the rubric that has not meaningfully moved in three months.
Adoption rates: the machine-readability stack
n = 282 · 1–31 Aug 2026
Beyond category scores, the rubric checks specific technical signals. These adoption rates show where the default behaviour of an audited site sits in August 2026 — and what changed from July.
Near-universal, essentially flat (95.0% in July). Still the most implemented signal.
Up from 82.8%. 15.6% of sites still risk duplicate-content ambiguity.
Flat versus 80.6% in July. One in five sites still ships a key page with no H1.
Down marginally from 78.6%. Most sites open key pages with a direct statement — sites that do average 20 points higher.
Up 0.6pp from 75.6%. But the composition changed sharply — see Organization below.
The rebound: up 8.6pp from 54.2%, fully reversing July’s regression.
Biggest single mover: up 9.9pp from 52.2%. Entity clarity starts here.
Essentially flat (58.9% in July) after June–July’s sharp rise.
Up from 26.9%. Still, 52% of llms.txt adopters publish a thin stub, not a real file.
Up 4.2pp from 18.1% — even though Google retired FAQ rich results in May 2026. Now added for AI extraction, not a SERP feature.
Up from 18.1%, moving in lockstep with FAQ schema. The content-vs-markup gap has closed.
Down 0.8pp from 17.5%. /.well-known/ai.txt and similar. Still the biggest untapped category.
Up from 9.7%. First upward move in blocking since the benchmark began.
The story of August is that the two AI-specific signals moved together for the first time. In June and July, schema adoption rose while llms.txt fell — teams brought traditional SEO habits but not AI-native ones. In August, llms.txt (+8.6pp), Organization schema (+9.9pp), and FAQ schema (+4.2pp) all climbed at once. The cohort that showed up in August understood both halves of the job.
llms.txt correlation
n = 282 · 1–31 Aug 2026+23 pts
Sites with llms.txt average 65.1/100. Sites without average 41.8/100. The gap widened from +20.0 pts in July to +23.3 pts in August — publishing an llms.txt remains the signal most correlated with a high GEO score.
Schema markup correlation
n = 282 · 1–31 Aug 2026+28 pts
Sites with valid JSON-LD average 63.2/100. Sites without average 34.7/100. The schema gap held near July's level (+28.2 → +28.5 pts). Structured data stays the highest-leverage technical signal.
Three months in: June → July → August
With three editions in the record, the trend is readable. The table below tracks the headline metrics across all three months.
| Metric | June | July | August | Trend |
|---|---|---|---|---|
| Unique domains | 288 | 360 | 282 | Cohort size is volatile |
| Average GEO score | 53.6 | 54.1 | 56.4 | Rising, accelerating |
| Median score | 57 | 55 | 59 | New high |
| Good or better | 20.8% | 24.7% | 29.1% | +8.3pp in two months |
| Below Good | 79.2% | 75.3% | 70.9% | Falling steadily |
| llms.txt adoption | 58.3% | 54.2% | 62.8% | Dipped, then rebounded past June |
| llms.txt (full / structured) | 27.8% | 26.9% | 30.1% | New high, slowly |
| Any schema markup | 70.1% | 75.6% | 76.2% | Up, then plateauing |
| Organization schema | 51.0% | 52.2% | 62.1% | Sharp August jump |
| FAQ schema | 13.2% | 18.1% | 22.3% | Rising despite SERP retirement |
| AI discovery endpoints | 16.0% | 17.5% | 16.7% | Flat / stalled |
| Blocks ≥ 1 AI crawler | — | 9.7% | 14.2% | First upward move |
| Avg word count | 1,224 | 1,157 | 1,299 | Noisy, no clear trend |
One caveat governs how to read every row in this table. Only 28 of August's 282 domains were also audited in July. Each edition is largely an independent sample of whoever came to GeoReady that month, so a month-over-month delta blends real behaviour change with cohort composition. July's 360-domain cohort followed a traffic spike and skewed toward newer, less-prepared sites; August's 282 skewed the other way. The direction of travel — up — has held for three months, but the month-to-month magnitude should be read as directional.
Among the 28 domains audited in both months, the average score moved from 56.3 to 57.9 — up 1.6 points, with 9 improving, 7 declining, and 12 unchanged. Individual sites move in both directions month to month; the aggregate creep upward is the signal.
The llms.txt rebound — and the stub problem underneath it
July's report flagged a 4.1-point drop in llms.txt adoption and attributed it to dilution: 72 new domains had entered the cohort without AI-specific signals. August confirms that reading. Adoption snapped back to 62.8% — higher than June's 58.3% — as a smaller, more deliberate cohort replaced July's influx. Full, structured files reached a new high of 30.1%.
The gap between "has an llms.txt" and "has a useful llms.txt" is still the real story. Of the 177 sites with a file, 85 publish a complete version and 92 publish a stub — a single line, or a handful of links with no structure. 52% of llms.txt adopters are shipping a placeholder. A stub is marginally better than nothing, but it gives an AI tool almost no orientation: no description of what the site is, no map of the important pages, no context to answer a question about the brand with specificity.
The correlation data explains why the effort is worth it. Sites with any llms.txt average 65.1/100; sites without average 41.8. That 23-point gap is not all causal — prepared teams do many things at once — but llms.txt is consistently the single strongest dividing line in the dataset, and it has been for three months.
The floor that will not rise: AI Discovery at 10% efficiency
Every other category improved or held in August. AI Discovery did neither in any meaningful way. The average score is 0.6 points out of 6 — a 10.0% capture rate, identical to July. Adoption of any AI discovery endpoint actually slipped from 17.5% to 16.7%. Across three editions, the numbers are 8.3% → 10.0% → 10.0% efficiency, and 16.0% → 17.5% → 16.7% adoption. This category is not trending; it is parked.
AI discovery files — /.well-known/ai.txt, and the structured signals inside a complete llms.txt — describe a site's purpose and its most important content in a form an AI can navigate deliberately. Nothing in a default CMS or hosting setup creates them. They exist only when someone decides to publish them, and in August almost nobody did.
That makes it the clearest arbitrage in the benchmark. Publishing a handful of lines at /.well-known/ai.txt moves a site into the top ~17% of the audited sample for this signal, immediately, with no content work and no backend change.
Opportunity sizing
A Foundation-band site that publishes a complete /.well-known/ai.txt, a structured llms.txt, and correct Organization + WebSite schema can reach the Good band without editing a single page of content. That is roughly 15–25 points of recoverable GEO score from three files. In August 2026, 83.3% of audited sites had not taken even the first step.
New in August: crawler blocking ticks up
For the first time in the benchmark's three editions, the share of sites blocking AI crawlers moved up month-over-month. 14.2% of audited sites now disallow at least one major AI bot in robots.txt, up from 9.7% in July, and 10.6% block three or more (up from 6.7%). The average site still explicitly allows 23.8 AI bots, so intentional blocking remains a minority position — but the direction changed.
Two forces likely sit behind it. Some of the increase is deliberate: publishers and content businesses reassessing whether unpaid AI crawling serves them, encouraged by machine-readable licensing frameworks like RSL 1.0 that arrived in late 2025. Some is almost certainly accidental — a blanket Disallow rule, a security plugin's default, or a staging config that shipped to production. The benchmark cannot tell the two apart from robots.txt alone.
The practical takeaway for most teams is unchanged: if you want AI visibility, confirm that GPTBot, ClaudeBot, PerplexityBot, Google-Extended, and GoogleOther are not being blocked by a rule you did not write on purpose. If you are deliberately opting out of unpaid crawling, do it explicitly and know which engines it affects.
By TLD: who is leading AI search readiness in August 2026
.com dominates the cohort at 155 of 282 domains and sits close to the overall average at 54.9. The extensions that outperform it are, once again, the ones associated with technical and AI-adjacent teams.
| TLD | Domains | Avg score | llms.txt | Schema |
|---|---|---|---|---|
| .com | 155 | 54.9 | 57.4% | 74.8% |
| .ai | 20 | 58.3 | 70% | 70% |
| .io | 10 | 66 | 90% | 80% |
| .it | 9 | 64.7 | 88.9% | 100% |
| .de | 7 | 54.4 | 28.6% | 85.7% |
| .net | 4 | 65.3 | 75% | 100% |
| .hk | 4 | 55.3 | 75% | 75% |
| .in | 4 | 52.5 | 50% | 50% |
| .app | 4 | 37.8 | 25% | 50% |
| .cn | 4 | 35.8 | 75% | 25% |
.io leads among TLDs with real sample size: 10 domains, a 66.0 average, 90% llms.txt adoption, and 80% schema. .io is the developer-tooling extension, and the pattern that showed up for .ai in June now shows up here — teams building for a technical audience treat machine-readability as table stakes.
.it stayed strong: 9 domains at a 64.7 average, 100% schema adoption, and — notably — 88.9% llms.txt adoption, up from 50% in July. The Italian cohort has closed the schema-vs-llms.txt gap that defined it in June, when schema sat at 81% and llms.txt at just 33%.
.ai slipped to mid-pack: 20 domains at 58.3, essentially flat on score, but llms.txt adoption fell from 82.4% to 70.0% as the cohort grew and diversified. The AI-native extension no longer has the commanding llms.txt lead it held in June (90%).
.de is the textbook skills-transfer case: 85.7% schema adoption but only 28.6% llms.txt — strong on the mature practice, weak on the new one. .cn remains the lowest-scoring TLD at 35.8, though on only 4 domains; its 25% schema adoption is the real drag. .app was the surprise laggard at 37.8 across 4 domains, pulled down by low adoption on both signals.
What August 2026 tells us about AI search readiness
The clean version of the story: the prepared cohort is pulling away, and it is doing so on every signal at once. In June and July, teams adopted schema (a mature SEO practice) faster than llms.txt (a new one). August is the first month where the AI-specific signals — llms.txt, Organization schema, structured Q&A — all moved up together. The vocabulary gap between traditional SEO and AI readiness is closing, at least among the sites that choose to measure.
The cross-tab makes it concrete. In August, 53.9% of audited sites have both schema and an llms.txt, up from 45.6% in July. The "schema but no llms.txt" group — the classic skills-transfer gap — shrank from 30.0% of the cohort to 22.3%. Teams that invest in structured data are now, more often than not, also publishing an llms.txt in the same pass.
Two things still hold the average down. AI Discovery has not moved in three months — it is a deliberate-publishing problem, and deliberate publishing is exactly what most teams have not gotten around to. And the stub problem persists: more than half of llms.txt files in the dataset are placeholders. Adoption is a vanity metric if the file is empty.
The correlations keep widening. Schema is worth +28.5 points of average score, llms.txt +23.3, FAQ schema +20.2, answer-first structure +19.9. The signals that separate a citable site from an invisible one are becoming more predictive over time, not less — which means the cost of ignoring them compounds.
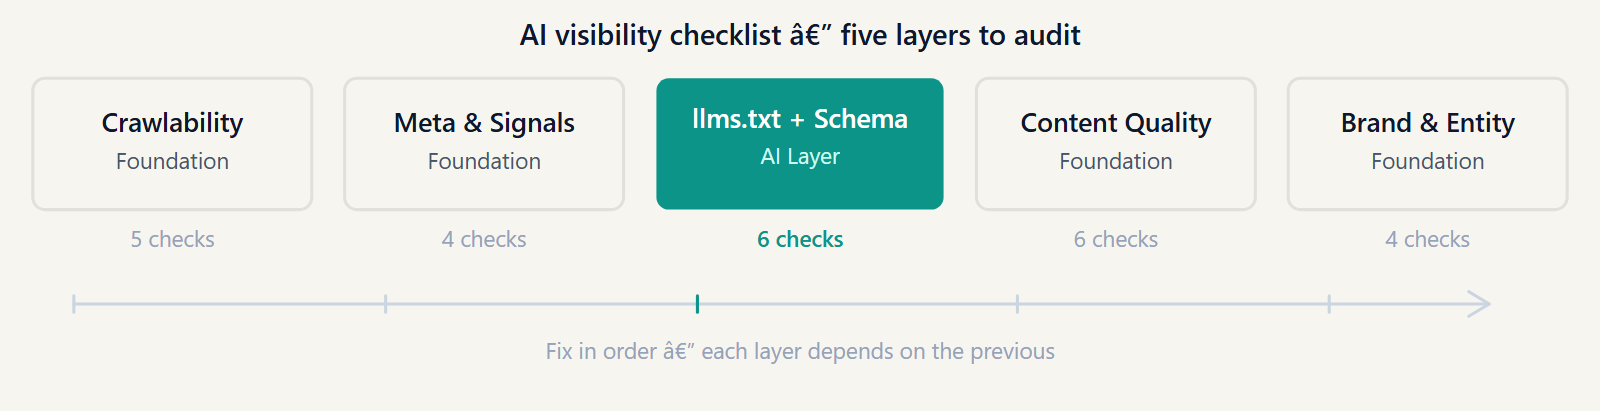
The August 2026 quick-win checklist
Based on where audited sites lose the most points in August — and the three-month trend — these are the highest-leverage actions, ordered by expected point recovery per hour of work:
- Upgrade a stub llms.txt to a real one. This is the biggest change since last month's checklist. Adoption is now 62.8%, but 52% of those files are placeholders. If you already have an llms.txt, the win is no longer "publish one" — it is "make it complete": a site description, sections for your key page groups, and real URLs to docs, product, pricing, and blog. Use the free llms.txt generator as a starting structure, then fill it in properly.
- Add Organization JSON-LD if you are in the 38% without it. Organization schema jumped to 62.1% adoption in August and is the fastest-moving signal in the dataset. Include
name,url,logo,sameAs(your verified social and Wikidata/Crunchbase profiles), anddescription. Pair it with WebSite schema. Sites with schema average 28.5 points higher. - Publish a
/.well-known/ai.txt. Still the clearest arbitrage: 83.3% of audited sites have not done it, and the number has not moved in three months. A few lines of file place you in the top ~17% for AI discovery immediately. - Check robots.txt for crawler blocks you did not intend. Blocking rose to 14.2% in August, some of it accidental. Confirm
GPTBot,ClaudeBot,PerplexityBot,Google-Extended, andGoogleOtherare allowed — or, if you are opting out on purpose, that you know exactly which engines the rule covers. - Structure your Q&A content — but adjust your expectations. Google retired FAQ rich results for all sites in May 2026, so FAQPage markup no longer earns a SERP feature. It still helps AI answer engines lift a clean question-and-answer pair. Keep real FAQ content on the page, mark genuine user Q&A with
QAPagewhere it fits, and do not add FAQPage expecting a Google result. - Lead key pages with a direct answer. 78% of audited sites do this, and they average nearly 20 points higher than those that do not. Open your important pages with a self-contained, quotable statement before the marketing context.
- Re-audit after each change. The rubric rewards compound improvements — llms.txt plus Organization schema plus an AI discovery file is more than the sum of its parts, because a model can triangulate a consistent entity across all three.
See where your site stands against the August 2026 benchmark
The average score in August 2026 is 56.4. Run a free audit to see your GEO score across all nine categories, identify which band you are in, and get the specific actions that recover the most points first.
Methodology
This report covers 282 unique domains audited by GeoReady between 1 August and 31 August 2026. When a domain was audited multiple times in the period, only the most recent audit is included — this prevents repeat users from inflating the cohort and ensures each domain appears once at its best-known state.
- Engine version: GEO Optimizer 4.15–4.17.x, the open-source 100-point, eight-category v1 rubric (the default before engine 4.19.0). The August cohort was scored predominantly on 4.16.2. Source available on GitHub.
- Audited sample: Sites that chose to audit with GeoReady — not a random sample of the web. Only 28 of the 282 August domains were also in July's cohort, so each monthly edition is largely an independent sample. The cohort skews toward teams already interested in AI visibility, so these figures likely overestimate readiness across all websites.
- Anonymized: Domain names are stored as salted HMAC-SHA256 hashes in the benchmark dataset. No individual domain is identifiable in the public figures.
- Monitoring audits excluded: Only user-initiated audits (web, API, CLI, tools) are included. Scheduled monitoring re-checks are excluded to avoid inflating the cohort with the same domains audited repeatedly.
- Consistent rubric: Every domain is scored with the same engine and the same weights. Category maxima: Robots 18, LLMs.txt 18, Schema 16, Meta 14, Content 12, Brand & Entity 10, Signals 6, AI Discovery 6.
- Month-over-month comparison: June and July figures are drawn from the same benchmark dataset using the same methodology (288 domains audited 10–30 June; 360 domains audited 1–31 July). The cohorts are independent — a domain audited in more than one month appears once per report at its most recent state for that period.
- Efficiency percentages are the category average divided by the category maximum, computed from one-decimal averages, so they may differ by ±0.1pp from a full-precision calculation.
The underlying benchmark dataset is the benchmark_audit_events table in the GeoReady production database. The public API endpoint (GET /api/public/benchmark) returns aggregated figures only — no per-domain data is ever exposed.
Get the September 2026 report when it drops
The State of GEO publishes monthly. Each edition adds a month to the trend line, tracks adoption rates signal by signal, and goes deeper on the categories that decide whether AI engines can cite you. Subscribe to get it the day it ships.
By submitting, you agree to receive the monthly GeoReady newsletter: benchmark data from the State of GEO dataset, practical GEO guidance, and product updates. You can unsubscribe anytime. See our Privacy Policy.
Frequently asked questions
What is the average GEO score in August 2026?
The average GEO score across 282 unique domains audited by GeoReady in August 2026 is 56.4 out of 100, up 2.3 points from July's 54.1 — the largest month-over-month gain since the benchmark began. The median is 59. 29.1% of audited sites now reach the "Good" band (68–85) or above, up from 24.7% in July and 20.8% in June. The share sitting below Good fell to 70.9%, down from 75.3%.
Did llms.txt adoption recover in August 2026?
Yes. llms.txt adoption rose from 54.2% in July to 62.8% in August — an 8.6 percentage-point rebound that more than reverses July's 4.1-point dip. Full, structured llms.txt files also grew, from 26.9% to 30.1%. July's decline was a dilution effect from a large influx of new domains; August's smaller, more AI-aware cohort pushed the rate back up. That said, 52% of llms.txt adopters still publish a thin stub rather than a complete file.
What is the biggest AI search readiness gap in August 2026?
AI Discovery, unchanged. Only 16.7% of audited sites expose any AI discovery endpoint (such as /.well-known/ai.txt), and the average AI Discovery score is 0.6 out of 6 points — a 10.0% efficiency rate, flat versus July and the third consecutive month stuck near that level. Every other category improved or held; AI Discovery is the one signal that has not moved.
How did schema markup adoption change in August 2026?
Overall schema adoption edged up from 75.6% to 76.2%, but the real move was Organization schema, which jumped from 52.2% to 62.1% — a 9.9 percentage-point gain, the largest single-signal increase in the dataset. FAQ schema also rose from 18.1% to 22.3%, even though Google retired FAQ rich results for all sites in May 2026 — teams are now adding it for AI answer extraction rather than a search feature. Schema category efficiency improved from 42.5% to 45.0%.
Are more sites blocking AI crawlers in August 2026?
Slightly. 14.2% of audited sites now block at least one major AI crawler in robots.txt, up from 9.7% in July, and 10.6% block three or more (up from 6.7%). The average site still explicitly allows 23.8 AI bots, so this is a minority behaviour — but it is the first month-over-month increase in blocking the benchmark has recorded, and worth watching as content-licensing frameworks like RSL 1.0 mature.
Which TLD leads AI search readiness in August 2026?
Among TLDs with at least five domains, .io leads with a 66.0 average score, 90% llms.txt adoption, and 80% schema adoption. .it remains strong at 64.7 with 100% schema adoption. .ai slipped to mid-pack at 58.3, and its llms.txt adoption fell from 82.4% to 70.0% as the cohort diversified. .cn stays at the bottom at 35.8, though on a very small sample.
How does this benchmark compare to the whole web?
This is a benchmark of sites that chose to audit with GeoReady, not a random sample of the web. Only 28 of August's 282 domains were also in July's cohort, so each monthly edition is largely an independent sample shaped by who visited GeoReady that month. The cohort skews toward teams already interested in AI visibility, so these figures almost certainly overestimate readiness across all websites. Read the month-over-month deltas as directional, not precise.
Beat the August 2026 average of 56.4
Run a free AI SEO audit to get your full GEO score, see which of the nine categories is costing you the most points, and get a ranked action list. No account required for the baseline snapshot.
New to AI search readiness?What is AI SEO ·What is llms.txt ·The July 2026 report
Newer edition:State of GEO: September 2026