State of GEO: September 2026
AI Search Readiness Across 704 Domains
In September 2026 (1–30 September), the 704 unique domains audited by GeoReady averaged a GEO score of 56.2 out of 100 — flat versus August's 56.4, while the sample grew from 282 domains. 28.8% reached the "Good" band or better, 57.4% had a detectable llms.txt, and 8.8% blocked at least one AI crawler. This fourth edition is the first in which the average did not rise. It also comes with a caveat the earlier ones did not need: September's rows were scored by four engine versions, with Organization-schema, Brand & entity and CJK detection changes landing mid-month. Month-over-month deltas are indicative, not purely behavioural.
Executive summary — September 2026
n = 704 · 1–30 Sep 202656.2
avg GEO score / 100 (−0.2 vs August)
704
unique domains (+422 vs August)
57.4%
have llms.txt (−5.4pp vs August; a lower bound in both months)
28.8%
Good or better (−0.3pp vs August)
- The sample grew from 282 to 704 domains and the average stayed flat (56.4 → 56.2). After 20.8% → 24.7% → 29.1%, the Good-or-better share paused at 28.8%.
- Four engine versions scored this cohort. 289 domains (41.1%) were audited on 4.17.1, before the month's detection changes; the other 415 on 4.18.1 or later. August was scored predominantly on 4.16.2.
- AI-crawler blocking fell back to 8.8% after August's first-ever rise to 14.2%. The series (9.7% → 14.2% → 8.8%) is not monotonic.
- AI Discovery is the lowest category for the fourth month: 8.3% efficiency, 15.2% adoption.
source: benchmark_audit_events · closed window 1–30 Sep 2026
Read this first: four engine versions in one month
Every earlier edition was scored on a near-single engine version — August's cohort was scored predominantly on 4.16.2. September's was not. The audit engine shipped several releases during the month, and each domain's latest audit was scored by whichever version was live that day:
| Version | Released | Domains | Scoring-relevant change |
|---|---|---|---|
| 4.17.1 | 31 Aug 2026 | 289 | Baseline for the month. Predates the 4.18.x detection changes below. |
| 4.18.1 | 17 Sep 2026 | 55 | LocalBusiness and ~25 Organization subtypes count as Organization schema; Brand & entity checks handle en-dash title separators and #about anchors. Includes 4.18.0 (12 Sep): CJK word counts no longer under-counted ~10×; the negative-signal check reads cleaned page text. |
| 4.18.2 | 19 Sep 2026 | 259 | Security patch (sitemap redirect validation). No scoring change described in the changelog. |
| 4.18.3 | 22 Sep 2026 | 101 | No scoring change applies to the figures in this report. |
Three groups of changes matter for this report, all in 4.18.0 and 4.18.1 — so in this cohort they reach the 415 domains audited on 4.18.1 or later. Organization schema: before 4.18.1, only the literal Organization type counted, so a site marked up as LocalBusiness or a subtype such as Restaurant scored as having no Organization schema and lost Brand & entity credit. Brand & entity detection: 4.18.1 also cuts titles at an en-dash separator when comparing brand names, and recognises same-page About links such as #about on single-page sites. Content: before 4.18.0, Chinese, Japanese and Korean pages were measured roughly ten times too short, which affected the word-count and front-loading checks and the llms.txt depth points (31 of the 704 September domains, 4.4%, declare a CJK page language); 4.18.0 also made the negative-signal check read the same cleaned page text as the other checks, so a large <noscript> fallback menu is no longer mistaken for keyword-stuffed copy.
These changes were made to correct missed credit and false penalties. Two consequences follow. First, 289 domains (41.1%) were scored on 4.17.1, before any of them, and August was scored predominantly on 4.16.2, which also lacked them. Second, our interpretation is that they are more likely to raise a September figure than to lower it — but their effect was not measured, and a change such as the brand-name separator can move an individual site's comparison either way. Every release is documented in the public changelog.
Score distribution: a bigger sample, a flat average
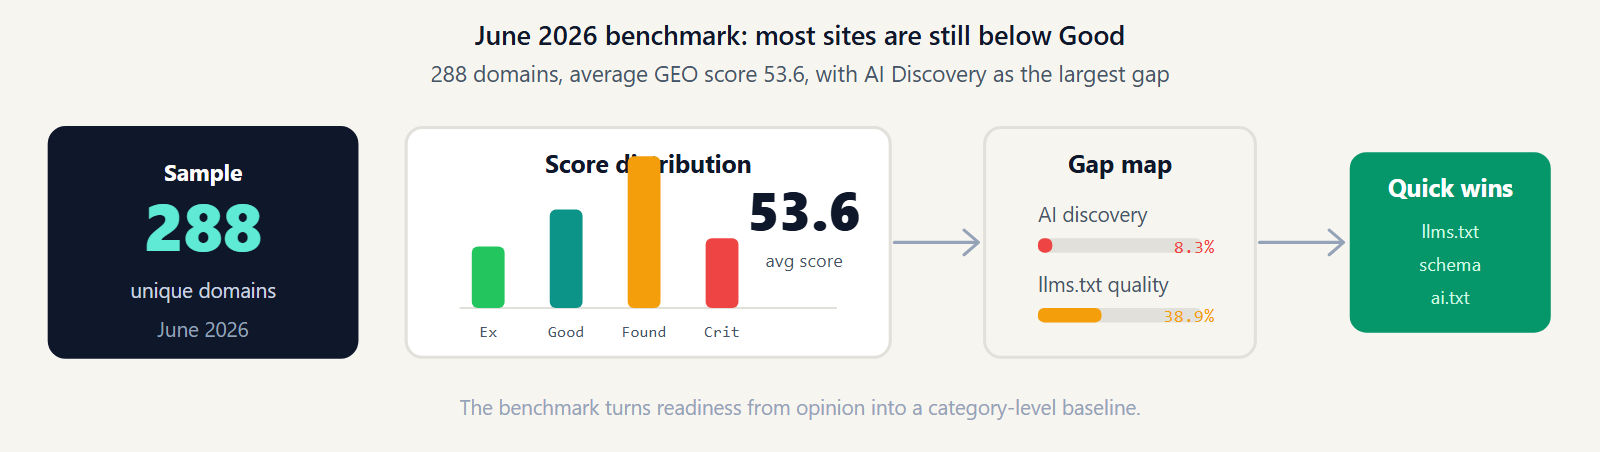
The average GEO score across 704 unique domains is 56.2 out of 100 — 0.2 points below August's 56.4, and still above July's 54.1 and June's 53.6. The median is 58, with the bottom quarter of sites scoring at or below 46 and the top quarter at or above 69. The highest score is 100; the lowest is 4. After two consecutive increases, this is the first month the average did not rise — in a cohort that is two and a half times larger than August's and, for the most part, made of different sites.
The band breakdown moved only slightly:
| Band | Score range | Domains | Share | August 2026 | What it means |
|---|---|---|---|---|---|
| Excellent | 86–100 | 13 | 1.8% | 2.5% (7) | All 8 categories well covered. Citable by AI with confidence. |
| Good | 68–85 | 190 | 27% | 26.6% (75) | Strong fundamentals. Minor gaps in entity signals or AI discovery. |
| Foundation | 36–67 | 411 | 58.4% | 57.4% (162) | Reachable by AI but thin on structure, entity, and discovery signals. |
| Critical | 0–35 | 90 | 12.8% | 13.5% (38) | Significant barriers — blocked crawlers, missing schema, no AI signals. |
The practical reading is unchanged: roughly seven in ten audited sites still cannot be described, cited, or recommended by an AI engine with confidence. The Good band edged up from 26.6% to 27.0% and Critical shrank from 13.5% to 12.8%, while Excellent slipped from 2.5% to 1.8% and Foundation grew from 57.4% to 58.4%. Four months in, the "below Good" series reads 79.2% → 75.3% → 70.9% → 71.2%: the decline paused rather than reversed.
Category breakdown: content up, llms.txt down
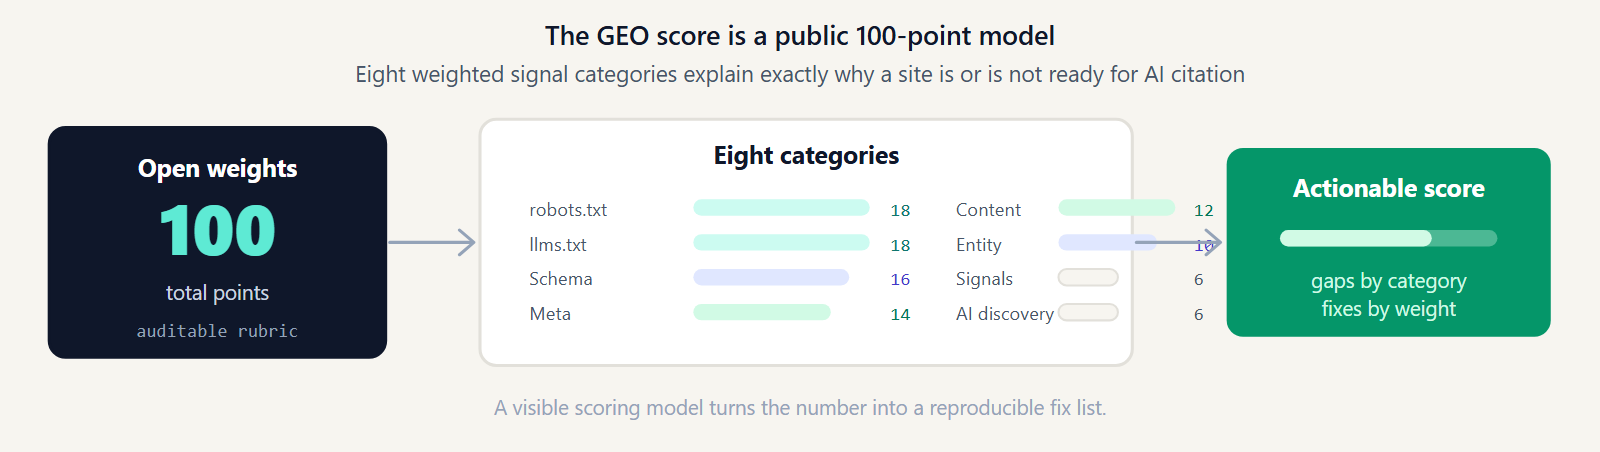
The GEO rubric scores eight categories, each with a different maximum. The table below shows the September 2026 average for each, the maximum, and the efficiency percentage — how much of the available points the average site captures — alongside the August, July and June efficiencies for context.
| Category | Avg | Max | Sep eff. | Aug | Jul | Jun | Efficiency bar |
|---|---|---|---|---|---|---|---|
| Meta tags | 12.7 | 14 | 90.7% | 90% | 88.6% | 88.6% | |
| Content quality | 9.9 | 12 | 82.5% | 78.3% | 80% | 80% | |
| Robots & crawler access | 13.8 | 18 | 76.7% | 77.8% | 76.1% | 75.6% | |
| Technical signals | 3.7 | 6 | 61.7% | 61.7% | 61.7% | 61.7% | |
| Schema markup | 7.2 | 16 | 45% | 45% | 42.5% | 38.1% | |
| Brand & entity | 4.1 | 10 | 41% | 41% | 38% | 38% | |
| LLMs.txt | 7.1 | 18 | 39.4% | 43.3% | 36.1% | 38.9% | |
| AI discovery | 0.5 | 6 | 8.3% | 10% | 10% | 8.3% |
The hygiene categories held. Meta tags lead at 90.7% efficiency and Robots and crawler access sits at 76.7%, with the average site still explicitly allowing 23.8 AI bots. Content quality posted the largest gain of any category, from 78.3% to 82.5%. Part of that may be the engine rather than the sites: the CJK word-count fix reached the domains audited on 4.18.1 or later. How much, the data cannot say.
The middle split. Schema markup (45.0%) and Brand & entity (41.0%) were unchanged from August — even though the LocalBusiness fix added Organization and entity credit for the 415 domains audited on 4.18.1 or later. LLMs.txt efficiency fell from 43.3% to 39.4%, the largest drop of any category, back near June's 38.9%. As in every edition, an llms.txt that a CDN or WAF refuses to serve to the auditor counts as absent, so this category is a lower bound — see the llms.txt section below.
AI Discovery is last again at 8.3% — an average of 0.5 points out of 6, down from 10.0% and back to June's level. It is the only category in the rubric that has been at the bottom in all four editions.
Adoption rates: the machine-readability stack
n = 704 · 1–30 Sep 2026
Beyond category scores, the rubric checks specific technical signals. These adoption rates show where the default behaviour of an audited site sits in September 2026 — and what changed from August.
Up from 94.7%. Still the most implemented signal.
Up from 80.5%, the largest move among the basic signals.
Essentially flat (84.4% in August).
Up from 78.0%. Sites that open with a direct statement average 16.9 points higher.
Up 1.2pp from 76.2% — a third consecutive monthly increase.
Up from 58.2%.
Essentially flat (62.1% in August), despite the LocalBusiness fix on later engine versions.
Down 5.4pp from 62.8%. A lower bound, as in every edition: files a CDN/WAF blocks for the auditor count as absent.
Down from 30.1%. 54.7% of llms.txt adopters publish a thin stub, not a real file.
Down 1.0pp from 22.3%.
Down from 22.3%, still in lockstep with FAQ schema.
Down 1.5pp from 16.7%. The lowest of the four editions.
Down from 14.2%. August’s rise did not continue.
The pattern of June and July is back: traditional on-page signals rose while the AI-specific ones slipped. H1, answer-first structure and schema went up; llms.txt, FAQ schema and AI discovery went down. In August both halves had moved up together. Our reading is that a much larger cohort brought in more sites with mature SEO habits and fewer AI-native ones — but with a new population and a mixed engine, that is an interpretation, not a measurement.
llms.txt correlation
n = 704 · 1–30 Sep 2026+21.4 pts
Sites with llms.txt average 65.3/100. Sites without average 43.9/100. The gap narrowed from +23.3 pts in August but remains one of the clearest dividing lines in the dataset.
Schema markup correlation
n = 704 · 1–30 Sep 2026+28.5 pts
Sites with valid JSON-LD average 62.6/100. Sites without average 34.1/100. The gap is identical to August's +28.5 pts. Structured data stays the highest-leverage technical signal.
Four months in: June → July → August → September
The table below tracks the headline metrics across all four editions. The sample size of every month is printed above the table, because the population changes month to month.
| Metric | June | July | August | September | Trend |
|---|---|---|---|---|---|
| Unique domains | 288 | 360 | 282 | 704 | Largest cohort yet |
| Average GEO score | 53.6 | 54.1 | 56.4 | 56.2 | Rose twice, then flat |
| Median score | 57 | 55 | 59 | 58 | Range-bound |
| Good or better | 20.8% | 24.7% | 29.1% | 28.8% | Climb paused |
| Below Good | 79.2% | 75.3% | 70.9% | 71.2% | Decline paused |
| llms.txt adoption | 58.3% | 54.2% | 62.8% | 57.4% | Oscillating; a floor every month |
| llms.txt (full / structured) | 27.8% | 26.9% | 30.1% | 26.0% | No clear trend |
| Any schema markup | 70.1% | 75.6% | 76.2% | 77.4% | Up every month |
| Organization schema | 51.0% | 52.2% | 62.1% | 61.5% | Held the August jump |
| FAQ schema | 13.2% | 18.1% | 22.3% | 21.3% | Rise paused |
| AI discovery endpoints | 16.0% | 17.5% | 16.7% | 15.2% | Flat to down |
| Blocks ≥ 1 AI crawler | — | 9.7% | 14.2% | 8.8% | Up, then down: not monotonic |
| Avg word count | 1,224 | 1,157 | 1,299 | 1,331 | Noisy; CJK fix applies from 4.18.1 |
Two caveats govern how to read every row. Only 43 of September's 704 domains were also audited in August, so each edition is largely an independent sample of whoever came to GeoReady that month; a month-over-month delta blends real behaviour change with cohort composition. And this month, as described above, it also blends in engine-version changes.
The 43 returning domains are the only like-for-like signal in the dataset. Their average moved from 55.7 in August to 57.6 in September — up 1.9 points, with 15 improving, 11 declining, and 17 unchanged. That is a small group, and its September audits may themselves have run on a newer engine version than its August ones, so it is a hint rather than a finding: the sites that came back scored a little higher, while the cohort as a whole did not.
llms.txt adoption: 57.4%, a measured drop and a measurement floor
In September 2026, 404 of the 704 audited sites (57.4%) had a detectable llms.txt, down from 62.8% in August; full, structured files fell from 30.1% to 26.0%. Over four editions the series reads 58.3% → 54.2% → 62.8% → 57.4%: it oscillates with the cohort rather than moving in one direction. With four closed monthly windows there is now enough history to say that much — and not much more.
Like every earlier figure, it is a floor. An llms.txt that a CDN or WAF refuses to serve to the auditor (HTTP 403 or 406) is recorded as missing, so the true September adoption rate is at or above 57.4%; how far above was not measured. Note what this does not explain: the same limitation applied to June, July and August, so it cannot account for the month-over-month drop. Our interpretation is that the larger, less AI-specific cohort did most of the work.
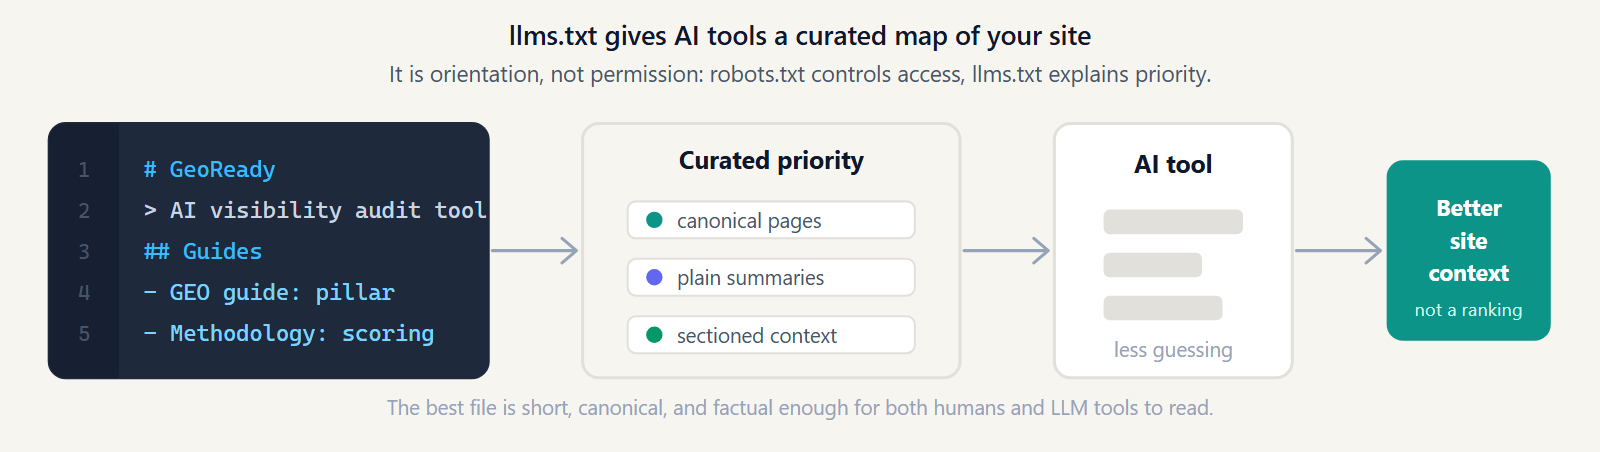
The quality gap underneath is unchanged. Of the 404 sites with a detected file, 183 publish a complete version and 221 publish a stub — a single line, or a handful of links with no structure. 54.7% of llms.txt adopters are shipping a placeholder, up from 52% in August — see the llms.txt placeholder problem. A stub gives an AI tool almost no orientation: no description of what the site is, no map of the important pages. The correlation still favours doing it properly — sites with any llms.txt average 65.3/100, sites without 43.9 — though that gap is not all causal: prepared teams do many things at once. New to the format? Start with what llms.txt is.
AI Discovery: last place, four editions running
In September 2026, only 15.2% of the 704 audited sites exposed any AI discovery endpoint, and the average AI Discovery score was 0.5 points out of 6 — an 8.3% capture rate, the lowest of the eight categories. Across four editions, efficiency reads 8.3% → 10.0% → 10.0% → 8.3%, and adoption of any AI discovery endpoint 16.0% → 17.5% → 16.7% → 15.2%. AI Discovery scoring did not change between 4.16.2, August's main engine, and 4.18.3, so its movement reflects cohort and behaviour, not the engine.
AI discovery files — /.well-known/ai.txt, and the structured signals inside a complete llms.txt — describe a site's purpose and its most important content in a form an AI can navigate deliberately. Nothing in a default CMS or hosting setup creates them. They exist only when someone decides to publish them.
Opportunity sizing
AI Discovery is worth 6 of the rubric's 100 points and requires no content work. In September 2026, 84.8% of audited sites had not published a single AI discovery endpoint — a few lines at /.well-known/ai.txt would move a site into the 15.2% that have.
AI-crawler blocking fell back to 8.8%
In September 2026, 8.8% of the 704 audited sites blocked at least one major AI crawler in robots.txt, down from 14.2% in August and below July's 9.7%; 5.1% blocked three or more, down from 10.6%. The August edition reported the first month-over-month rise in AI-crawler blocking; September did not continue it. The average site still explicitly allows 23.8 AI bots, unchanged from August.
Put plainly: the movement is not monotonic. Three data points — 9.7%, 14.2%, 8.8% — measured on three largely different populations do not make a trend in either direction, and August's rise should not be read as the start of one. Blocking remains a minority behaviour in this sample. The robots.txt check and its AI-bot list did not change between 4.16.2 and 4.18.3, so this is a cohort-and-behaviour signal, not an engine one.
The practical takeaway is unchanged: if you want AI visibility, confirm that GPTBot, ClaudeBot, PerplexityBot, Google-Extended, and GoogleOther are not being blocked by a rule you did not write on purpose. If you are deliberately opting out of unpaid crawling, do it explicitly and know which engines it affects. The robots.txt guide for AI bots lists the user agents.
By TLD: who is leading AI search readiness in September 2026
.com dominates the cohort at 375 of 704 domains and sits close to the overall average at 56.6. The table lists every TLD with at least eight domains in September; most groups are still small.
| TLD | Domains | Avg score | llms.txt | Schema |
|---|---|---|---|---|
| .com | 375 | 56.6 | 58.9% | 80% |
| .ai | 29 | 61 | 75.9% | 72.4% |
| .fr | 25 | 57 | 40% | 92% |
| .de | 24 | 60.3 | 54.2% | 83.3% |
| .ca | 15 | 54.6 | 66.7% | 60% |
| .io | 15 | 56.5 | 66.7% | 80% |
| .org | 13 | 41.8 | 23.1% | 53.8% |
| .app | 12 | 56.3 | 66.7% | 83.3% |
| .net | 12 | 55.9 | 50% | 75% |
| .it | 10 | 49.8 | 40% | 40% |
| .cn | 10 | 40.5 | 60% | 30% |
| .in | 9 | 50.3 | 33.3% | 55.6% |
| .cz | 8 | 46.5 | 62.5% | 37.5% |
| .dev | 8 | 56.5 | 62.5% | 75% |
| .nl | 8 | 69.8 | 87.5% | 100% |
.ai is the strongest group with real sample size: 29 domains, a 61.0 average and 75.9% llms.txt adoption, the highest llms.txt rate of any TLD with more than ten domains. .de follows at 60.3 across 24 domains, with llms.txt adoption at 54.2% — on a much larger group than August's seven .de domains. .nl has the highest average of all at 69.8, with 100% schema adoption, but on only 8 domains.
.fr is this month's skills-transfer case: 92.0% schema adoption but only 40.0% llms.txt — strong on the mature practice, weak on the new one. .org (41.8) and .cn (40.5) are the lowest-scoring groups; .org combines the lowest llms.txt rate in the table (23.1%) with 53.8% schema, and .cn the lowest schema rate (30.0%).
.it shows how small groups swing: 10 domains at 49.8 with 40.0% schema, against 9 domains at 64.7 with 100% schema in August. A handful of different sites is enough to move a small TLD's numbers that far, so single-TLD comparisons across months should be read with care.
What September 2026 tells us about AI search readiness
The honest version: a sample two and a half times larger did not move the average. That is informative on its own. August's 56.4 came from 282 sites; September's 56.2 comes from 704, most of them new to the benchmark. Readiness in this audited population looks closer to a plateau in the mid-50s than to the steady climb the first three editions suggested — with the caveat, again, that the engine mix and the population both changed.
The cross-tab shows where the cohort shifted. In September, 48.9% of audited sites have both schema and an llms.txt, down from 53.9% in August. The "schema but no llms.txt" group — the skills-transfer gap — grew from 22.3% to 28.6%. 8.5% have only an llms.txt and 14.1% have neither. Given that the llms.txt figure is a floor, part of the schema-only group may in fact have a file the auditor could not reach.
The correlations held their order. Schema is worth +28.5 points of average score, llms.txt +21.4, FAQ schema +19.4, answer-first structure +16.9. These gaps describe the audited sample, not a causal effect, but they have pointed the same way in every edition.
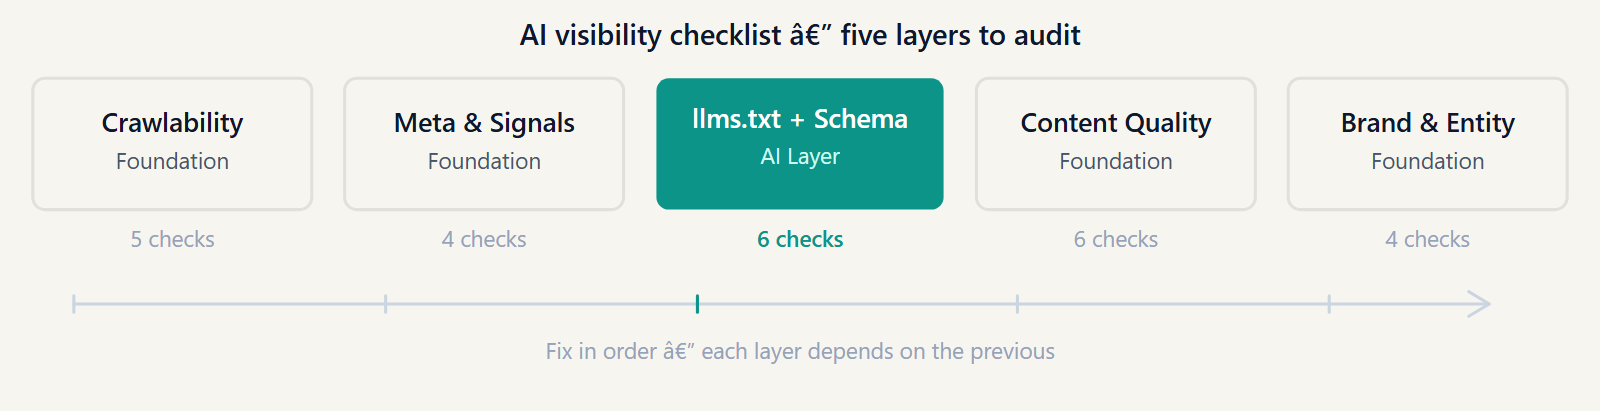
The September 2026 quick-win checklist
Based on where audited sites lose the most points in September — and the four-month trend — these are the highest-leverage actions:
- Upgrade a stub llms.txt to a real one. 54.7% of detected llms.txt files are placeholders. The win is a complete file: a site description, sections for your key page groups, and real URLs to docs, product, pricing, and blog. Use the free llms.txt generator as a starting structure, then fill it in properly.
- Make sure crawlers can actually fetch your llms.txt. If a CDN or WAF answers bots with 403 or 406, AI tools may never see the file. Request it with a non-browser User-Agent to check.
- Add Organization JSON-LD if you are in the 38.5% without it. Include
name,url,logo,sameAs(your verified social and Wikidata/Crunchbase profiles), anddescription, and pair it with WebSite schema.LocalBusinessand its subtypes count from engine 4.18.1 onward. Sites with schema average 28.5 points higher. More on Organization schema and sameAs. - Publish a
/.well-known/ai.txt. Still the clearest arbitrage: 84.8% of audited sites have not done it, and adoption is lower than in June (16.0%). - Check robots.txt for crawler blocks you did not intend. 8.8% of audited sites block at least one AI bot. Confirm
GPTBot,ClaudeBot,PerplexityBot,Google-Extended, andGoogleOtherare allowed — or, if you are opting out on purpose, that you know exactly which engines the rule covers. - Structure your Q&A content — but adjust your expectations. Google retired FAQ rich results for all sites in May 2026, so FAQPage markup no longer earns a SERP feature. It still helps AI answer engines lift a clean question-and-answer pair. Only 21.3% of audited sites mark it up. See FAQPage schema for AI search.
- Lead key pages with a direct answer. 81.1% of audited sites do this, and they average 16.9 points higher than those that do not. Open your important pages with a self-contained, quotable statement before the marketing context.
- Re-audit if your last audit predates engine 4.18.1 (released 17 September). Earlier engine versions could miss LocalBusiness schema and under-count CJK pages. A fresh audit runs on the current engine.
See where your site stands against the September 2026 benchmark
The average score in September 2026 is 56.2. Run a free audit to see your GEO score across all eight categories, identify which band you are in, and get the specific actions that recover the most points first.
Methodology
This report covers 704 unique domains audited by GeoReady between 1 September 00:00 UTC and 1 October 00:00 UTC 2026. When a domain was audited multiple times in the window, only its latest audit is included — so repeat users do not inflate the cohort, and each domain appears once, at the state of its last audit that month. 502 of the 704 domains were audited exactly once.
- Population filter: user-initiated audits recorded by the GeoReady web app (
source = 'web'). Scheduled monitoring re-checks are excluded, so the same domains are not counted repeatedly. Audits were recorded on every day of the month; a one-day spike on 10 September (150 audits across 114 distinct domains, 147 of them without a signed-in user) is included. - Engine version: GEO Optimizer 4.17.1 (289 domains), 4.18.1 (55), 4.18.2 (259) and 4.18.3 (101) — the open-source 100-point, 8-category rubric. Scoring weights did not change, but detection changes landed mid-month (see engine versions). Month-over-month deltas are indicative. Source available on GitHub.
- Audited sample: sites that chose to audit with GeoReady — not a random sample of the web. Only 43 of the 704 September domains were also in August's cohort, so each monthly edition is largely an independent sample, and the population changes month to month. The cohort skews toward teams already interested in AI visibility, so these figures likely overestimate readiness across all websites.
- Domain identity: a domain is identified by the last two labels of its hostname. For multi-part country suffixes (
co.uk,com.au,co.nz,co.kr,org.nz) this merges distinct sites into one row, so they are slightly under-counted. In September this affected 5 cohort rows. The same rule applied in every earlier edition. - Anonymized: domains are deduplicated by a salted HMAC-SHA256 hash of the domain. This report publishes aggregates only — no domain names.
- Reproducibility check: before computing September, the same query was re-run on the August window and reproduced the published August figures (282 domains).
- Consistent rubric: category maxima are Robots 18, LLMs.txt 18, Schema 16, Meta 14, Content 12, Brand & Entity 10, Signals 6, AI Discovery 6. Full definitions are on the methodology page.
- Month-over-month comparison: June, July and August figures are the ones published in their editions, drawn from the same benchmark dataset with the same method (288 domains audited 10–30 June; 360 audited 1–31 July; 282 audited 1–31 August).
- Efficiency percentages are the category average divided by the category maximum, computed from one-decimal averages, so they may differ by ±0.1pp from a full-precision calculation.
- License and citation: the figures in this report are published under CC BY 4.0. Cite as: GeoReady, "State of GEO: September 2026", geoready.dev/state-of-geo/september-2026/.
The underlying benchmark dataset is the benchmark_audit_events table in the GeoReady production database. The public API endpoint (GET /api/public/benchmark) returns aggregated figures only — no per-domain data is ever exposed.
Get the October 2026 report when it drops
The State of GEO publishes monthly. Each edition adds a month to the trend line, tracks adoption rates signal by signal, and goes deeper on the categories that decide whether AI engines can cite you. Subscribe to get it the day it ships.
By submitting, you agree to receive the monthly GeoReady newsletter: benchmark data from the State of GEO dataset, practical GEO guidance, and product updates. You can unsubscribe anytime. See our Privacy Policy.
Frequently asked questions
What is the average GEO score in September 2026?
The average GEO score across 704 unique domains audited by GeoReady in September 2026 is 56.2 out of 100, essentially flat versus August's 56.4 (−0.2) and the first month since the benchmark began in which the average did not rise. The median is 58. 28.8% of audited sites reach the "Good" band (68–85) or above, versus 29.1% in August; 71.2% sit below Good. The sample grew from 282 to 704 domains, so the cohort is a different population from August's.
Why are September 2026 month-over-month changes only indicative?
September's rows were scored by four engine versions — 4.17.1 (289 domains), 4.18.1 (55), 4.18.2 (259) and 4.18.3 (101) — whereas August's cohort was scored predominantly on 4.16.2. Releases during the month changed detection in ways that can affect the score: LocalBusiness and its subtypes now count as Organization schema, several Brand & entity checks were corrected, and CJK word counts are no longer under-counted (4.18.0 and 4.18.1; 415 of the 704 domains were scored on 4.18.1 or later). A month-over-month delta therefore mixes behaviour change, a different population and engine changes.
Did llms.txt adoption fall in September 2026?
The measured rate fell from 62.8% in August to 57.4% in September, and full, structured files from 30.1% to 26.0%. Read it with two caveats. The cohort is 2.5 times larger and largely new. And an llms.txt that a CDN or WAF serves to the auditor with a 403 or 406 is counted as absent — in this edition as in every earlier one — so 57.4%, like the prior months' figures, is a floor rather than an exact level. Because the same limitation applied to August, it does not explain the drop. Of the 404 sites with a file, 54.7% publish a thin stub.
What is the biggest AI search readiness gap in September 2026?
AI Discovery, for the fourth month running. Only 15.2% of audited sites expose any AI discovery endpoint (such as /.well-known/ai.txt), and the average AI Discovery score is 0.5 out of 6 points — 8.3% efficiency, the lowest of the eight categories. Across four editions efficiency reads 8.3% → 10.0% → 10.0% → 8.3%, and adoption 16.0% → 17.5% → 16.7% → 15.2%.
Are more sites blocking AI crawlers in September 2026?
No — fewer. 8.8% of audited sites block at least one major AI crawler in robots.txt, down from 14.2% in August and below July's 9.7%; 5.1% block three or more (10.6% in August). The August edition reported the first rise in blocking; September did not continue it. The series is not monotonic, and with a population that changes every month, one month's move in either direction is not a trend. The average site still explicitly allows 23.8 AI bots.
Which TLD leads AI search readiness in September 2026?
Among TLDs with at least eight domains, .nl has the highest average at 69.8 (87.5% llms.txt, 100% schema), but on only 8 domains. Among larger groups, .ai averages 61.0 across 29 domains with 75.9% llms.txt adoption, and .de 60.3 across 24. .com, with 375 of the 704 domains, sits at 56.6, close to the overall average. .cn (40.5) and .org (41.8) are lowest. Most TLD groups are small, so single-TLD figures swing a lot from month to month.
How does this benchmark compare to the whole web?
This is a benchmark of sites that chose to audit with GeoReady, not a random sample of the web. Only 43 of September's 704 domains were also in August's cohort, so each monthly edition is largely an independent sample shaped by who visited GeoReady that month. The cohort skews toward teams already interested in AI visibility, so these figures almost certainly overestimate readiness across all websites. Read month-over-month deltas as directional — and, this month, as partly an engine-version effect.
Beat the September 2026 average of 56.2
Run a free AI SEO audit to get your full GEO score, see which of the 8 categories is costing you the most points, and get a ranked action list. No account required for the baseline snapshot.
New to AI search readiness?What is AI SEO ·What is llms.txt ·The August 2026 report ·July 2026 ·June 2026